
Answer
Once an FRO (Financial Report Outline) has been created, you then have the ability to create a report as well as add columns.
To start this process, select the Drillpoint Tab in Excel and click on the Report Wizard icon.
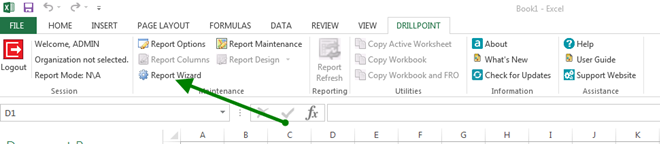
The Report Wizard is being used since we are creating a new report rather than editing an existing report. The Wizard will display the steps necessary to create and set up your Report. On the First Screen select Next

Step 1: Select FRO
-
Select your organization
-
Select the FRO (Financial Report Outline)
-
Enter a Description
-
Select Next

Step 2: Report Content
Indicate if you would like to include the following:
-
“Include Un-posted GL Transactions”
-
“Include Adjustment Entries”
-
“Include Account Security Warning Message”
To do this, check the box next to the appropriate option(s), this will prevent Viewer type users from changing the option(s) - Designers will still be able to make changes
Select Next
Step 3: Drill Down Options
The drill down feature allows a user to see the detail behind any of the figures on a report
Select the appropriate options:

Once your option(s) have been indicated, select Next.
Step 4: Formatting Options
Indicate if you would like to include the following:

Once you have made your selections, click Next.
You have now completed the Report Wizard and can proceed to the Column Wizard - click Next.
Step 1: Definition

This wizard will allow you to add columns to your worksheet (Column B to Column AZ). You will be able to give each column a title, Hide a Column when Report is run or Reverse the sign for the column. You will designate the Column and Transaction type and select from Net Activity, Beginning Balance and Ending Balance.
There are few different type of columns, dependent upon the type of column you are creating that will dictate what options will be presented. In this example, we are creating an Actual type column to include Net Activity and all Transaction Types. When you have made your designations on this screen, click Next.
Step 2: Date Range
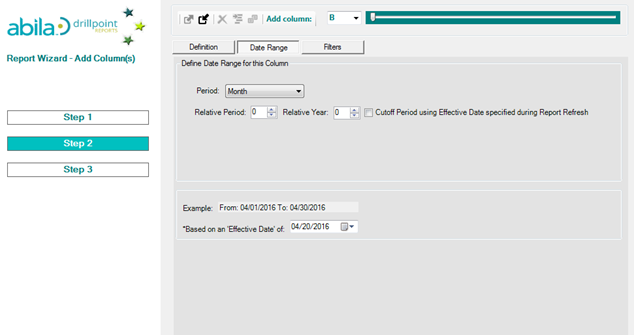
Indicate the time period for this column: Month, Quarter, Year, *Explicit, **Custom
*Explicit can be a range of one day to any range of any number of days
**Custom. Which can be a custom range to your liking
Other options: “Cutoff Period using Effective Date specified during Report Refresh” and “Based of ‘Effective Date’ of “
Once you have completed this step, select Next.
Step 3: Filters
Allow s you to indicate any Segment or UDF (User Defined Fields) filters you wish to apply to the column.

Once you have reached the filter screen, you can then make the appropriate selection as to your next action:
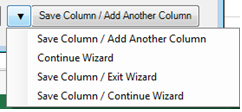
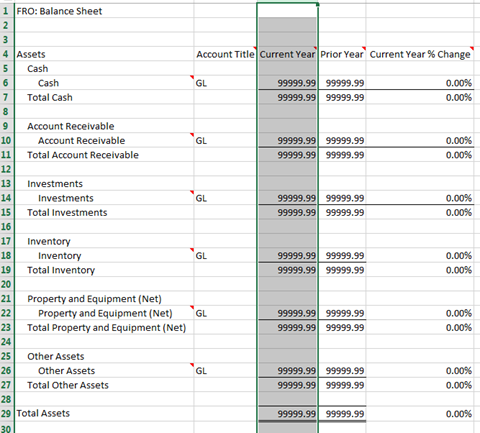
Once you have completed your column(s) creation and saved, for our example we would end up with a report with the following layout, which reflects the layout before doing a refresh:
Reporting Tips:
-
You can change your Report set up by clicking on the Report Options
-
To change your columns, select Report Columns in Design mode of the report
-
Remember you can you use the same FRO for many different reports
-
Please back up your report via the save option within Excel
-
Backup your FRO’s by backing up the NPSSQLSYS database in MIP Fund Accounting
Article Type
Product Info
Product Line
MIP Fund Accounting
Product Module/Feature
DrillPoint
Ranking